2024-2025 College Football Clutch Performance Index
HomeRepository
Check out the full code and data on GitHub.
Overview
Gauging how "clutch" (their ability to win in close game situations) can be tricky. For instance, saying a team is clutch because they win a lot of close one possesion games can be misleading. This is because final scores can lack context of the entire game. For example, a team may be up three possesions with two minutes left and the opposing team scores two touchdowns in garbage time. Does this make the winning team clutch? No. It goes both ways too. In an attempt to measure a team's "clutchness", I created a custom metric that takes into account the win probability of a team with two minutes left in the game and then calculated the expected win total for the 2024-2025 regular season and compared it to their actual win total. If it's positive, that means that team won more than expected in close game situations, and if it's negative, they lost more than expected.
Tech Stack
- R (tidyverse, cfbfastR)
- Tableau Public
- Git/GitHub
Data Source
All data used in this project was sourced from cfbfastR, a package in R that provides play-by-play data for college football games, amongst other features.
Project Highlights
- Obtained access to the cfbfastR play-by-play data for the 2024-2025 College Football season. Cleaned and formatted data to my liking.
- Calculated expected win totals for every team based on their win probability nearest to the two minute warning for each game.
- Exported results to Tableau, created bar charts comparing the top 25 most and least clutch teams, along with a list
- Published my findings to Tableau Public and Substack
Clutchness Factor Metric
In this project, I define a team's Clutchness Factor (CF) for a specific game as the result of the game (1 for win, 0 for loss) minus their win probability with two minutes left to go. So, a team with a 99% win probabilty with two minutes left that won would only recieve a CF of 0.01, while a team with a 20% win probability that won would receive a CF of 0.8 and the opposing team who lost would recieve a CF of -0.8. This metric is then summed across all games for each team to get their overall Clutchness Factor for the season. Note that the CF for a given team for the entire season is simply their actual win total minus expected win total with two minutes remaining.
Findings
After computing the expected win totals, I found that Iowa St. was the most clutch team with a win expectancy of 8.353 compared to a win total of 10.
- The Cyclones received 0.87 CF points in their 20–19 win over Iowa, coming back from a 19–7 deficit and winning on a last-second 54-yard field goal.
- Iowa State received 0.97 CF points in their 38–35 win over UCF. They came back from only a 3% chance to win after UCF was driving in ISU territory up 5 with 2 minutes left, forcing a punt. ISU then drove 11 plays, 80 yards, in 1:18 to take the lead and win.
- Iowa State lost 0.839 CF points in their 23–22 loss to Texas Tech after blowing an 83.9% win probability. The Red Raiders drove 71 yards in 1:47 to score and win.
- Iowa State received 0.63 CF points in their 31–28 win over Utah. They scored a touchdown to take the lead, and Utah missed a 54-yard field goal that would have tied the game.
On the other side, the Virginia Tech Hokies was the least clutch team with 8.507 expected wins compared to their actual win total of 6.
- The Hokies lost 0.83 CF points in their week 1 loss to Vanderbilt. VT trailed 17–3 at halftime, rallied to take a 27–20 lead, but gave up a touchdown at the end of regulation and ultimately lost in overtime.
- VT would lose 0.25 CF points at home to a loss to Rutgers. VT came back from a 23–7 deficit in the fourth quarter with two touchdowns and two two-point conversions, but a chip-shot field goal with 1:56 left gave Rutgers the lead and the win.
- Next week, VT would lost to Miami, losing them 0.465 CF points. After Miami took a 38–34 lead, Virginia Tech began their final drive. Hokie fans know what came next — a last-second completed Hail Mary that was overturned.
- Then, the Hokies lost to Syracuse which costed them 0.90 CF points. Syracuse won 38–31 in overtime after having only about a 10% chance on their final possession to tie the game.
- Note: There were no instances where VT gained more than 0.0001 CF points in any game — all of their wins that season were essentially shoe-ins.
Dashboard
Screenshot of dashboard built on Tableau Public:
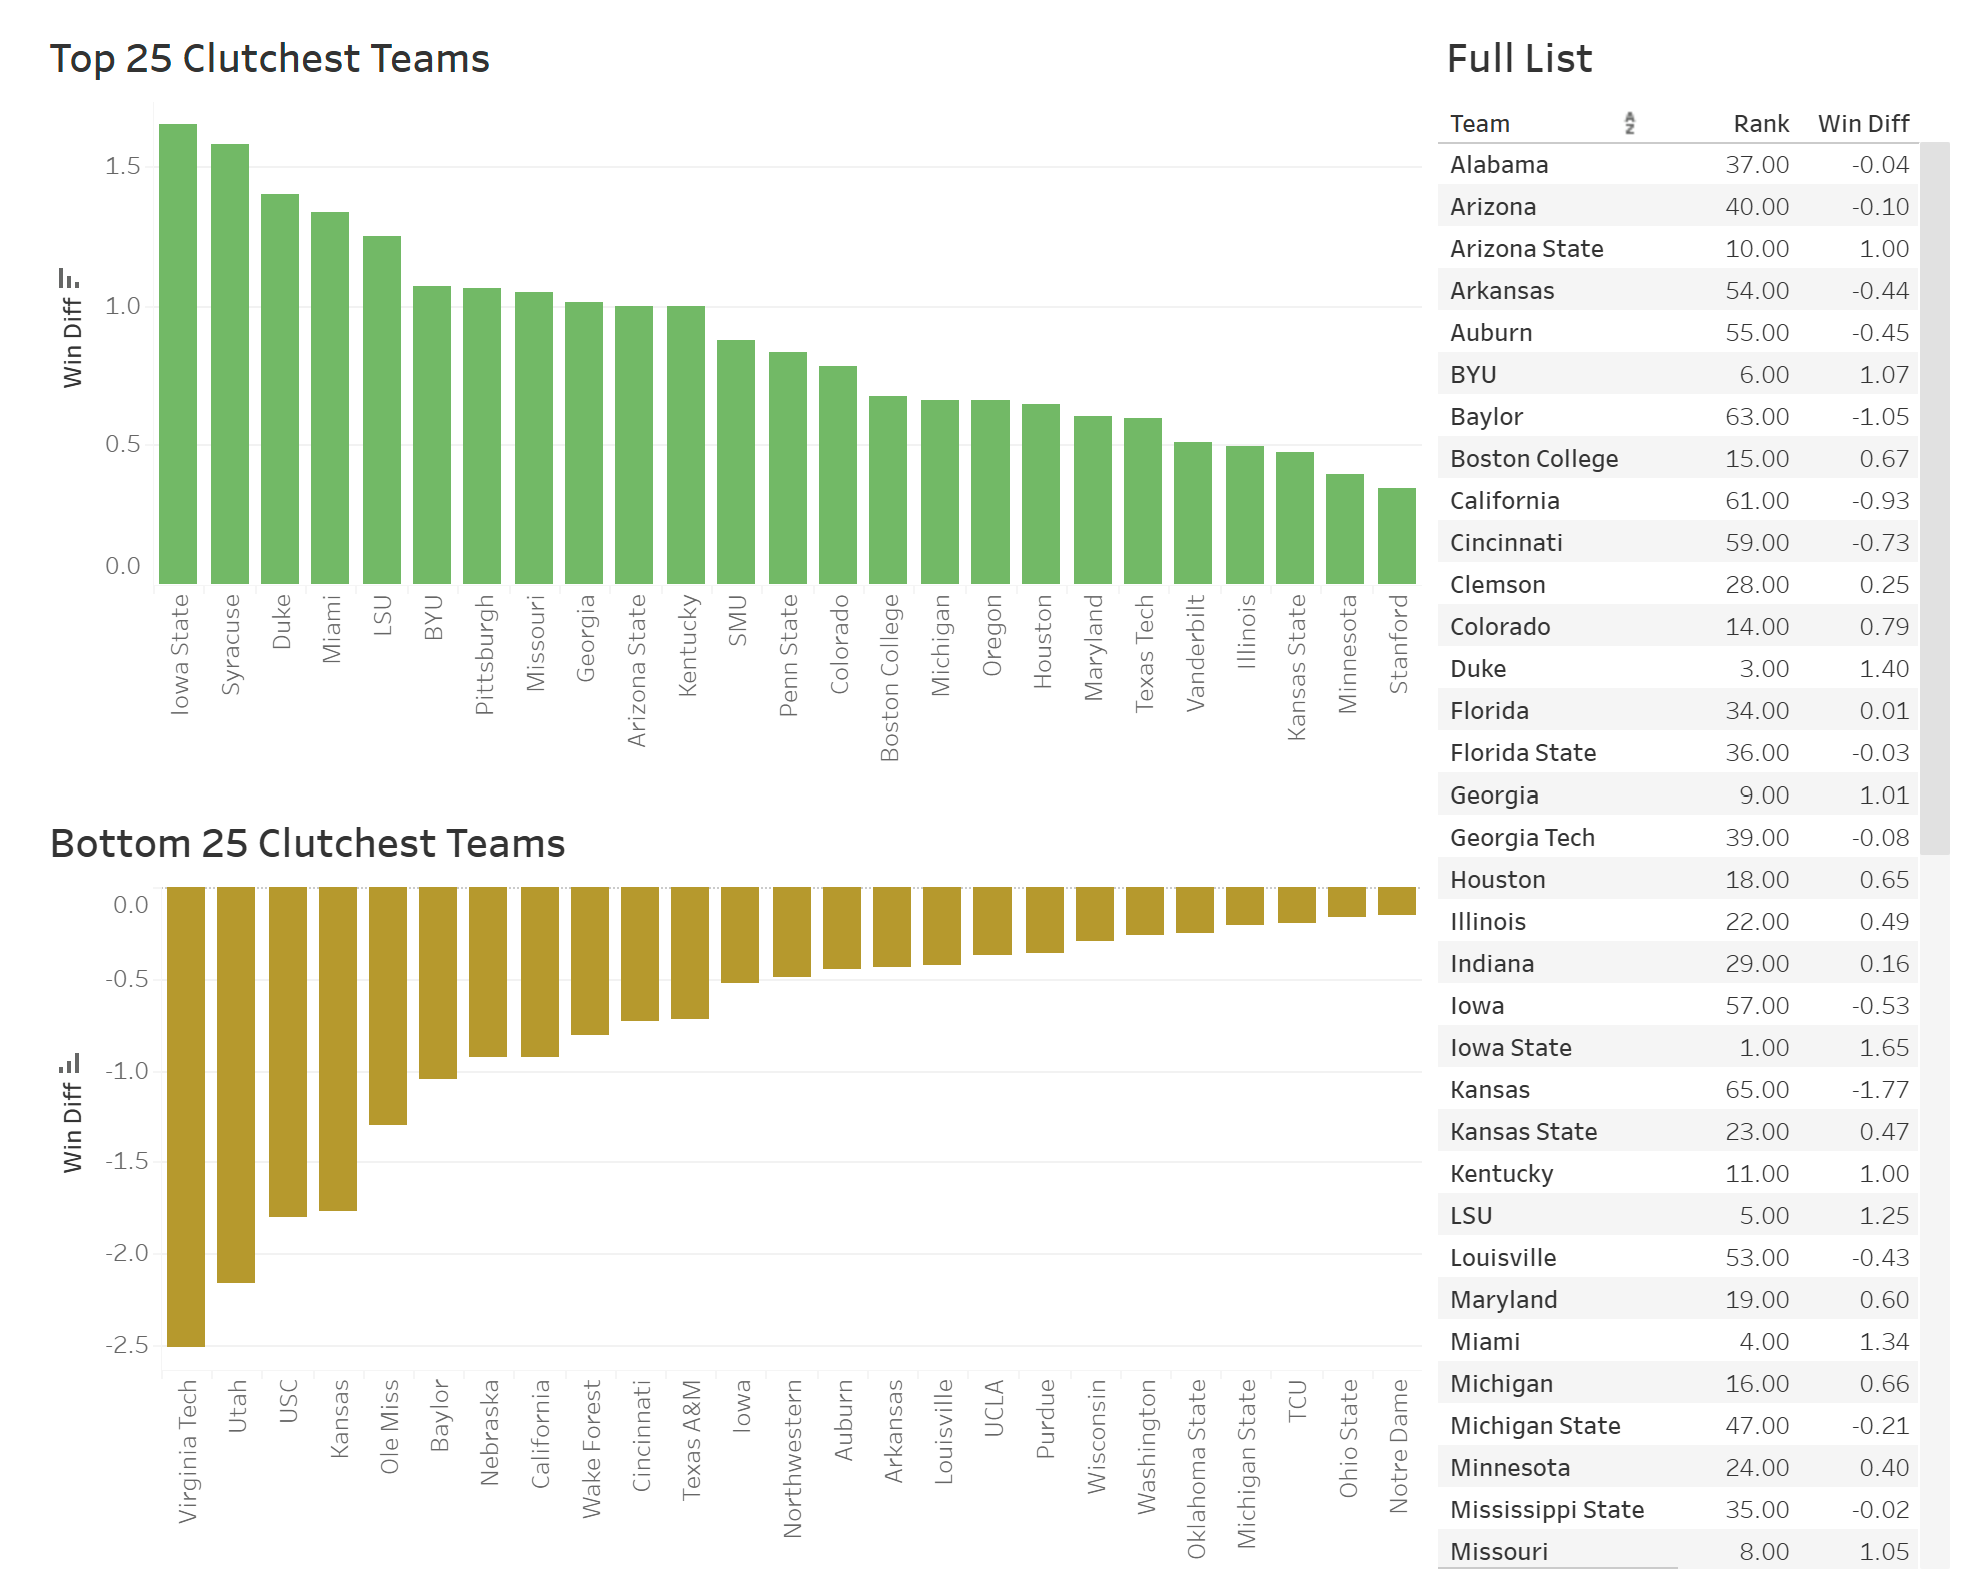
View interactive dashboard on Tableau Public here.